
Browse all guides
ADD TO YOUR WIDGET
Web data
Real answers from the internet, fresh every time your widget draws.
In this guide
The world, on your Home Screen#
Some things worth glancing at don’t live on your iPhone: what a euro is worth today, whether the earth shook overnight, who leads the championship. Web data asks a public service and puts the answer in your widget.
- Exchange rates
- Today’s rates for more than 160 currencies, any pairs side by side, and their history back to 1999. From Frankfurter.
- Earthquakes
- The latest earthquakes around the world, and the strongest of recent days. From the U.S. Geological Survey.
- Wikipedia today
- The picture of the day, the featured article, on this day, the news, the most read and more, in 60 languages.
- Formula 1
- This season’s races, standings and results, with drivers, teams, cars and tracks, as they happen.
Add web data#
Start with a style
Every service offers ready-made styles. Each one shows a real answer from today, so you see what you’ll get before you add it.
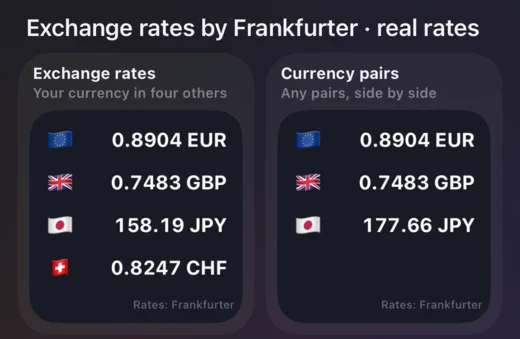
Open Web data
With nothing selected, tap Add → Text & Data → Web data.
Pick a starting style
Each service offers a few, already showing today’s real answers: a list of rates, the next session counted down, the picture of the day, a chart of the points race.
Make it yours
The style is added as ordinary layers. Change the type, colors and layout with the usual tools, then tap Save.
Change what it asks#
Select a list from the web, open List → Shows, and tap Set up. Choose the currencies, the driver, the language, or whatever that service offers. Drag to reorder; the answer updates as you go.
With nothing selected, the Web data tool in the toolbar lists everything the widget asks the web for. Edit, rename, duplicate or delete a request there. Before deleting, it shows what uses it.
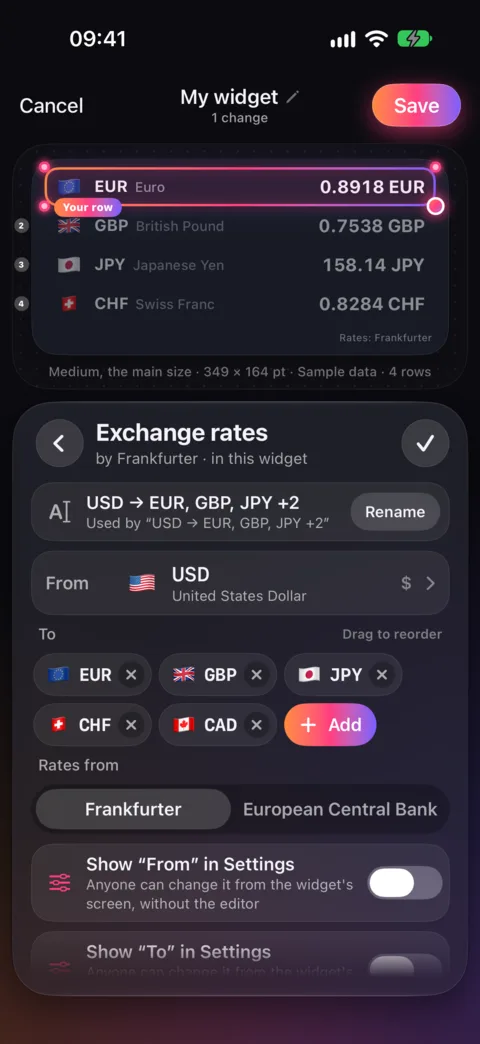
Choose what it asks: from which currency, to which ones.
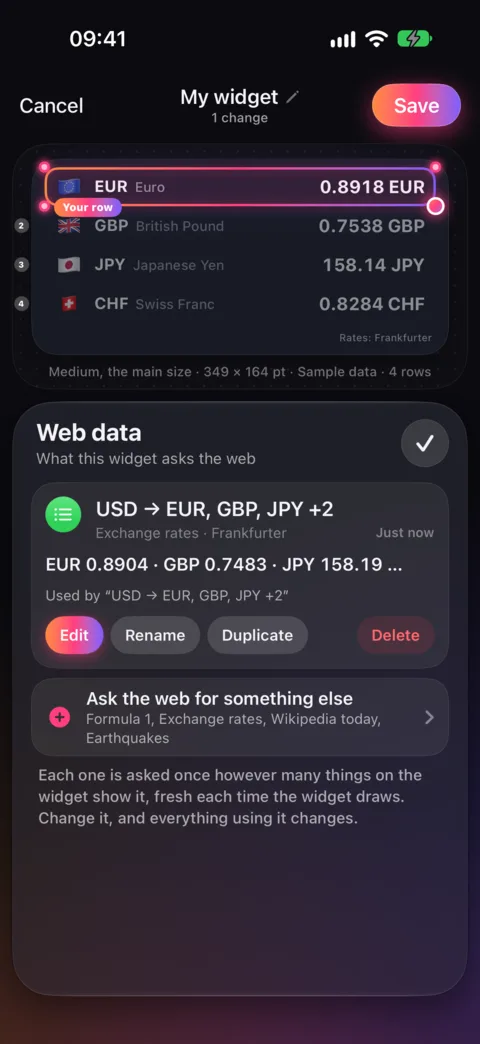
Everything the widget asks the web for, in one place.
Show one value as text#
Select a text, open Content, and choose Live data. In the picker, open Web, choose a service, and tap the value you want: a single rate, today’s article title, the time of the next session.
Before tapping Use, choose how it reads: with a symbol, decimals, words before or after, or a rate flipped the other way round.
Lists, charts and Looks#
- A list
- Under Add → Group & List → List, the From the web section makes one entry per row of the answer. See how lists work.
- A chart
- Select a chart and open Data. Web data that has numbers can be drawn, such as a rate’s last 30 days, or points per driver. Also draw adds a second line. See how charts work.
- A Look
- In a Look’s When, choose a web value: show a rate in green when it’s above a number, or dim an answer that’s getting old. See how Looks work.
- A setting
- Turn on Show “…” in Settings while setting up a request, and the choice can be changed later without the editor. See Settings.
Fresh, and fine offline#
Your widget asks again each time it draws, so the answer is the latest one. No account, permission or key is needed.
Without a connection, the widget keeps showing the last answer it got and can say how old it is, such as “Offline · 2 h ago”. Gallery previews and Sample data use example answers.
The services are credited at the bottom of Library → Connections. Starting styles also carry a small credit on the widget, such as “Rates: Frankfurter”.
Checked against the app · October 21, 2026.
Screenshots use example data or the app’s test image.